Contents
设置输出
输出格式
gnuplot> help term
 Gnuplot supports a large number of output formats. These are selected by
 choosing an appropriate terminal type, possibly with additional modifying
 options. See `set terminal`.
some formats
gnuplot> set term

Available terminal types:
             aifm  Adobe Illustrator 3.0 Format
             dumb  ascii art for anything that prints text
         epslatex  LaTeX picture environment using graphicx package
              gif  GIF images using libgd and TrueType fonts
             jpeg  JPEG images using libgd and TrueType fonts
            latex  LaTeX picture environment
               mf  Metafont plotting standard
               mp  MetaPost plotting standard
              png  PNG images using libgd and TrueType fonts
       postscript  PostScript graphics, including EPSF embedded files (*.eps)
          pslatex  LaTeX picture environment with PostScript \specials
              svg  W3C Scalable Vector Graphics driver
             tgif  TGIF X11 [mode] [x,y] [dashed] ["font" [fontsize]]
              x11  X11 Window System
          ... 部分略
ascii输出
gnuplot> set term dumb
Terminal type set to 'dumb'
Options are 'feed  79 24'
gnuplot> plot sin(x)


      1 ++---------------***--------------+---***----------+--------**-----++
        +               *+ *              +   *  *         +  sin(x) ****** +
    0.8 ++              *   *                *    *               *    *   ++
        |              *     *               *    *               *    *    |
    0.6 ++             *     *              *      *              *     *  ++
        *             *       *             *      *             *       *  |
    0.4 +*            *       *             *      *             *       * ++
        |*            *        *           *        *           *        *  |
    0.2 +*            *        *           *        *           *        * ++
        | *          *         *          *          *          *         * |
      0 ++*          *         *          *          *          *         *++
        |  *        *           *         *          *         *           *|
   -0.2 ++ *        *           *         *          *         *           *+
        |  *        *            *       *            *       *            *|
   -0.4 ++ *        *            *       *            *       *            *+
        |   *      *             *      *              *      *             *
   -0.6 ++  *     *              *      *              *      *            ++
        |    *    *               *     *              *     *              |
   -0.8 ++   *    *                *   *                *   *              ++
        +    **  *       +         *  *   +              * +*               +
     -1 ++-----**--------+----------***---+--------------***---------------++
       -10              -5                0                5                10
输出文件
- 输出文件
set output 'filename' - 大小
set size m,n,m,n为放大、缩小的倍数(相对于当前大小)
gnuplot> set t png
Terminal type set to 'png'
Could not find/open font when opening font "arial", using internal non-scalable font
Options are 'nocrop medium '
gnuplot> set output 'test.png'
gnuplot> set size 2,2
gnuplot> plot sin(x) title 'sin',cos(x) title 'cos'
gnuplot>
常用绘图设置
坐标范围
- 改变坐标范围
set xrange[min:max],set yrange[min:max] - 只在本次绘图中有效
plot [xmin:xmax] [ymin:ymax] f(x) - gnuplot自动设置
set autoscale - 可以只设置x或者只设置y的范围
- 可以只设置范围上限或者下限
set xrange[min:]
坐标名称
- 设置名称
set xlabel 'xlabel',set ylabel 'ylabel' - 取消名称
unset xlabel,unset ylabel
标题
- 标题
set title 'title' - 标题
unset title
曲线标题
- 曲线标题
plot f(x) title 'title' - 放置位置
set key x,y;x,y为坐标 - 重置为默认位置
set key default - 不显示曲线标题
unset key - 曲线标题框
set key box
同时绘制多个函数
- 用逗号分隔函数:
plot f1(x),f2(x),f3(x)...fn(x)
网格
- 添加
set grid - 取消
unset grid
gnuplot> set title 'test gnuplot'
gnuplot> set xlabel 'x label'
gnuplot> set ylabel 'y label'
gnuplot> set xrange[-5:5]
gnuplot> set yrange[-1:1]
gnuplot> plot sin(x)

                                    test gnuplot
  y label
      1 *****--+------------+-------------+--------*****+------------+-----++
        |    * +            +             +      **    **     sin(x) ****** |
        |     **                                **       *                  |
        |       *                              *          **                |
    0.5 ++      **                            *             *              ++
        |         *                          *              *               |
        |         *                         *                *              |
        |          *                        *                 *             |
        |           *                      *                  **            |
      0 ++          *                     *                     *          ++
        |            **                  *                      *           |
        |             *                 *                        *          |
        |              *                *                         *         |
   -0.5 ++              *              *                          *        ++
        |               *             *                            **       |
        |                **          *                              *       |
        |                  *       **                                **     |
        |      +            **    **      +             +            + *    |
     -1 ++-----+------------+*****--------+-------------+------------+--*****
              -4           -2             0             2            4
                                       x label
gnuplot> set key box
gnuplot> set grid
gnuplot> plot sin(x) title 'sin',cos(x) title 'cos'
test gnuplot
y label
1 *****--+------------+-----------#####------*****+------------+-----++
| * + + ### + ### ** ** sin-******+|
| ** : ## : ##** :* cos ######||
| :* : # : *# : ** +---------+|
0.5 ++......**.................#..........*..#..........*..............++
| : * : ## : * ## : * : |
# : * : # : * # : * : #
|# : * : # : * # : * : #|
|# : * : # :* # : ** : #|
0 ++#.........*..........#..........*..........#..........*.........#++
| # : ** : # *: # : * : # |
| # : * : # * : # : * : # |
| # : * :# * : #: * : # |
-0.5 ++...#..........*...#..........*................#.........*....#...++
| #: * #: * : :# **:# |
| # **#: * : :## *# |
| :# # *: ** : : # #** |
| + ## ## ** ** + + ## ## + * |
-1 ++-----+---####-----+*****--------+-------------+-----####---+--*****
-4 -2 0 2 4
x label变量
- 变量名不区分大小写
- 变量赋值后即存在
show variables简写为sh v
gnuplot> a=1
gnuplot> b=2
gnuplot> sh v


    User and default variables:
    pi = 3.14159265358979
    NaN = NaN
    GNUTERM = "x11"
    a = 1
    b = 2
函数
- 内置函数,如
sin(x),cos(x),log(x)等 - 自定义函数,如
f(x)=x*x; plot f(x) show function查看用户定义函数
gnuplot> sh fu

    User-Defined Functions:
    ln is undefined
    f(x)=x*x
文件绘图
数据文件data内容如下:
10  0.781  0.73  0.963
20  0.281  0.827  0.93
30  0.281  0.257  0.63
40  0.731  0.7  0.3
50  0.481  0.87  0.6
60  0.681  0.57  0.12
plot 'data'将自动使用第一、二列数据作为x,y坐标绘图plot 'data' with lines将点连起来plot 'data' with linespoint将各点连起来并用符号标记点plot 'data' using 1:3 with linespoint指定用1、3列作为x、y坐标plot 'data' using 1:($3/3)、plot 'data' using 1:($3+$4),分别表示以第三列的3分之一、第三列和第四列的和作为y坐标plot 'data' using 1:(sin($3))对某一列使用函数
gnuplot> plot 'data' with lines


    0.8 ++------------+------------+-------------+------------+------------++
        *             +            +             +            'data' ****** +
        |*                                       ***                        |
    0.7 ++*                                     *   *                      ++
        |  *                                   *     **                    **
        |   *                                 *        *                 ** |
        |   *                                *          *              **   |
    0.6 ++   *                              *            **          **    ++
        |     *                            *               *       **       |
        |      *                          *                 **   **         |
    0.5 ++      *                         *                    **          ++
        |        *                       *                    *             |
        |         *                     *                                   |
    0.4 ++         *                   *                                   ++
        |          *                  *                                     |
        |           *                *                                      |
        |            *              *                                       |
    0.3 ++            **************                                       ++
        |                                                                   |
        +             +            +             +            +             +
    0.2 ++------------+------------+-------------+------------+------------++
        10            20           30            40           50            60

gnuplot> plot 'data' using 1:3 with linespoint


    0.9 ++------------+------------+-------------+------------+------------++
        +             +            +             +  'data' using 1:3 **A*** +
        |           **A                                    **    **         |
    0.8 ++     *****   *                                ***        **      ++
        |  ****         *                            ***             *      |
        A**             *                          **                 **    |
    0.7 ++               *                       A*                     ** ++
        |                 *                     *                         **|
        |                  *                   *                            |
    0.6 ++                  *                **                            +A
        |                    *              *                               |
    0.5 ++                   *             *                               ++
        |                     *           *                                 |
        |                      *         *                                  |
    0.4 ++                      *       *                                  ++
        |                        *    **                                    |
        |                        *   *                                      |
    0.3 ++                        * *                                      ++
        |                          A                                        |
        +             +            +             +            +             +
    0.2 ++------------+------------+-------------+------------+------------++
        10            20           30            40           50            60

gnuplot> plot 'data' using 1:($3+$4) with linespoint


    1.8 ++------------+------------+-------------+------------+------------++
        +      *******A            +          'data' using 1:($3+$4) **A*** +
        A******        *                                                    |
    1.6 ++              *                                                  ++
        |                *                                                  |
        |                 *                                   A             |
        |                  *                                ** *            |
    1.4 ++                  *                             **    *          ++
        |                    *                           *       *          |
        |                    *                         **         *         |
    1.2 ++                    *                       *            *       ++
        |                      *                    **              *       |
        |                       *                 **                 *      |
      1 ++                       *            ***A                    *    ++
        |                         *    *******                         *    |
        |                          A***                                 *   |
        |                                                                *  |
    0.8 ++                                                                *++
        |                                                                  *|
        +             +            +             +            +             A
    0.6 ++------------+------------+-------------+------------+------------++
        10            20           30            40           50            60
常用命令
pwd  (present working directory)当前工作目录
cd  '< directory >'(come directory)到某个目录,<directory>是想要到的目录名,如gnuplot>cd '/root/gnuplot'
clear 清空输出的图像
exit和quit 退出gnuplot,也可简写为q
pause <seconds>暂停一段时间,<seconds>为时间,单位为秒
print <var> 其中<var>为变量名,例如gnuplot>a=1 gnuplot> print a1 输出a的值
也可输出字符串
gnuplot> print 'hello'hello  输出字符串hello
也可以用双引号代替单引号,有何区别?在上面的例子中输出是完全一样的,但下面的例子将显示其区别
gnuplot> print 'hello\neveryone'hello\neveryone
gnuplot> print “hello\neveryone”helloeveryone
即单引号屏蔽转义符号 '\',而双引号则不会,它将 \n 看成换行,另外还有 \t 表示制表符。
help 获得帮助 ,如 help term可以看到关于terminal的帮助
命令简写
命令plot 'file.dat' with lines
可简写为plot 'file.dat' with  l
进一步简写为plot 'file.dat' w  l
同理:
命令plot 'file.dat' with linespoints
简写为plot 'file.dat' w  lp
set terminal简写set term,
进一步可简写为set ter、se  t
set output 简写 set out,进一步可简写为se o
show 简写为 sh
show variables简写为 sh v
脚本功能
- 注释,使用 "#"
- 很长的行可以用
\\断行写 call 'script'在gnuplot环境下调用画图脚本gnuplot script在shell下直接执行画图脚本
实例
用gnuplot画sar数据。 需要注意的是 set timefmt指定的是读取数据文件的格式,而 set format x指定的是x轴显示的格式。如果不指定set format,类似00:10:01这样的数据会默认显示成10:00[2]。
#!/bin/bash

#-----------------------------------------------------------
# Usage: gnuplot sar
# $Id: sar.sh  i@annhe.net  2015-08-01 15:26:33 $
#-----------------------------------------------------------

log_dir="/var/log/sa"
font="/usr/share/fonts/wqy-microhei/wqy-microhei.ttc"

for id in `ls $log_dir`;do
    data_plot="/tmp/plot-data-$id.dat"
    script_plot="/tmp/plot-script-$id.ptl"
    file="$log_dir/$id"
    sar -f $file > $data_plot
    sed -E -i 's/时|分/:/g' $data_plot
    sed -i 's/秒//g' $data_plot
    title=`head -n 1 $data_plot`
    sed -i '1,3d;$d' $data_plot
    sed -i 's/^00:/0:/g' $data_plot
    sed -i 's/:0/:/g' $data_plot
    cat >$script_plot<<EOF
set term png size 1000,700 font '$font'
set output '$id.png'
set title '$title'
set xdata time
set timefmt "%H:%M:%S"
set format x "%H:%M:%S"
set xlabel '时间'
set ylabel '值'
plot '$data_plot' using 1:3 with linespoint title '%user',\\
    '$data_plot' using 1:4 with linespoint title '%nice',\\
    '$data_plot' using 1:5 with linespoint title '%system',\\
    '$data_plot' using 1:6 with linespoint title '%iowait',\\
    '$data_plot' using 1:7 with linespoint title '%steal',\\
    '$data_plot' using 1:8 with linespoint title '%idle'
EOF

gnuplot $script_plot
done
效果图
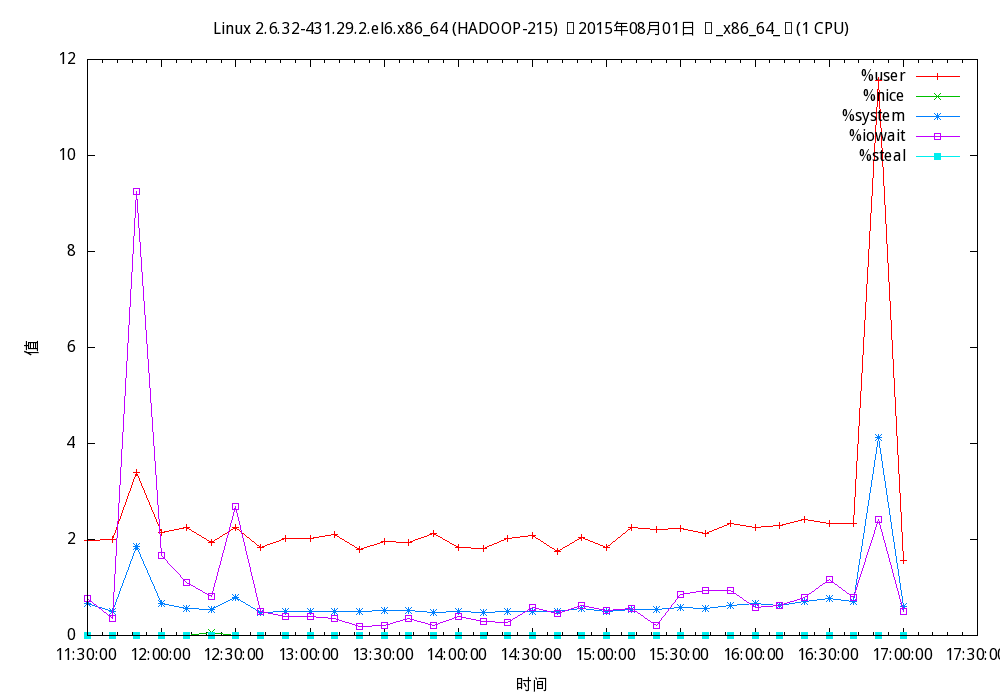
gnuplot sar
发表回复